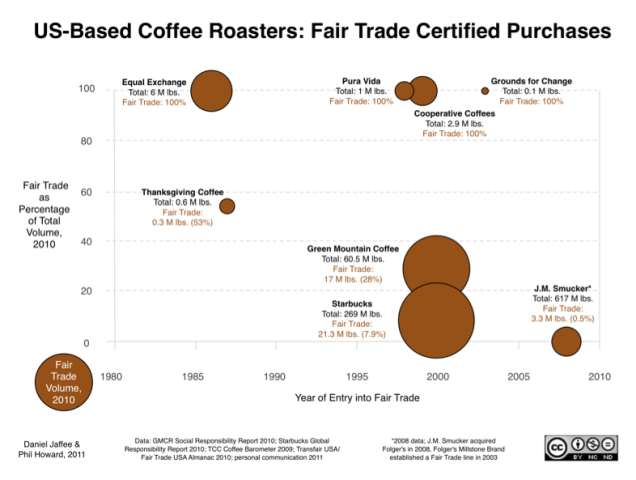
Last night, a grad student from the pioneering agroecology department at UC Santa Cruz turned me on to some recently published infographics on the Fair Trade system. (Thanks, Nick.) I am publishing a link to the graphs here because they are a pleasure to behold. And they also help, at a time of great upheaval within the Fair Trade system, to illustrate what all of the fighting is about.
The lead author of the graphs is Dan Jaffee from Washington State University, whose book Brewing Justice has been essential reading for industry leaders, activists and consumers concerned about the welfare of the smallholder farmers behind their coffee. But it is his co-author, Phil Howard of Michigan State, who has specialized in developing beautiful and insightful infographics to illustrate diverse facets of U.S. food systems, including: the structure of the beer and soft drink industries, production, processing and distribution of certified organic commodities, and even the spread of food-borne illnesses.
And now coffee.
These are achievements in graphic design, but they also help illustrate what all of the fighting in the Fair Trade movement over the last 10 years has been about. (Or what the genteel academics who authored the work refer to more diplomatically as “a decade of struggles within the fair trade movement over the nature of its relationship to large (often transnational) corporate firms, some of which have contributed to the dramatic growth of fair trade sales.”)
The graphic pictured above is particularly helpful in this regard, as it shows the dimensions of each company’s commitment to Fair Trade both in terms of total FT volume (breadth) and FT volume as a percentage of total volume (depth). If deep commitment is your thing, then Equal Exchange and Cooperative Coffees and the other importers/roasters with a 100% commitment to FT come off looking good. If your vision of impact is volume-driven, then you notice that Green Mountain’s 28% commitment to FT in 2010 moved more FT coffee than all the 100% companies combined. Beauty, in other words, is in the eye of the beholder, and depends an awful lot on the lens through which the beholder sees these graphs in particular, and processes of social and economic change more broadly.
Relentless promotion of both these visions by committed advocates of each explain an awful lot of what the fighting “struggles within the fair trade movement” are all about.


