Earlier this week, two academics published an insightful Fair Trade infographic that sheds some light on the current rift in the Fair Trade movement.
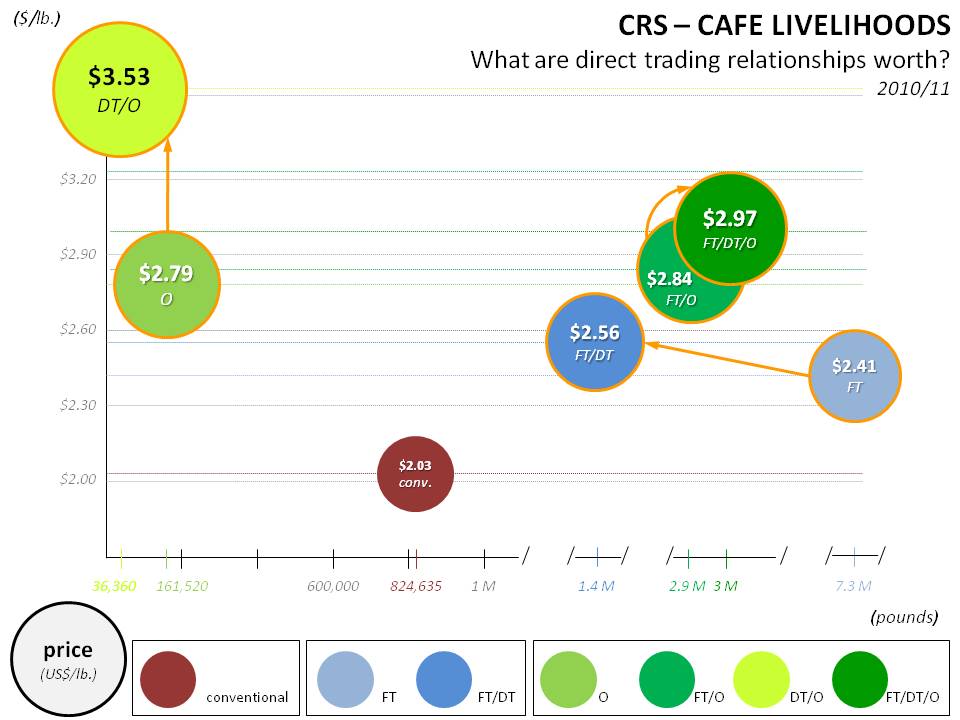
Today, I try my hand at putting data from our CAFE Livelihoods project into an infographic that may contribute to the discussion. Our project data from the 2010/11 harvest suggest that Fair Trade coffee sold through Direct Trade relationships with fully committed Fair Trade companies earns a higher price than Fair Trade coffee sold through more traditional, mediated channels.
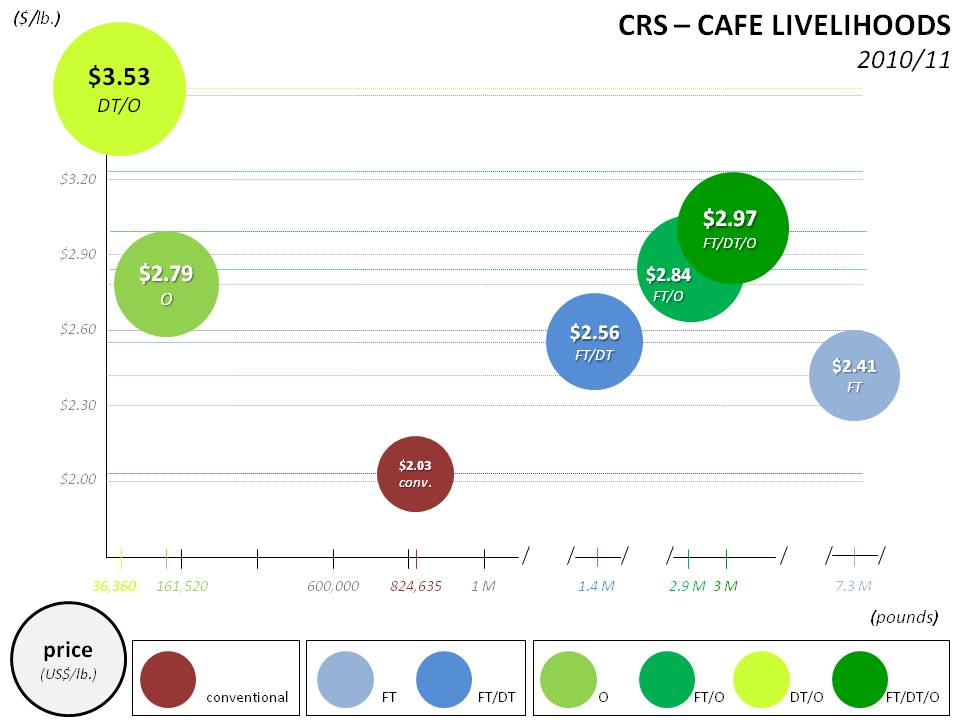
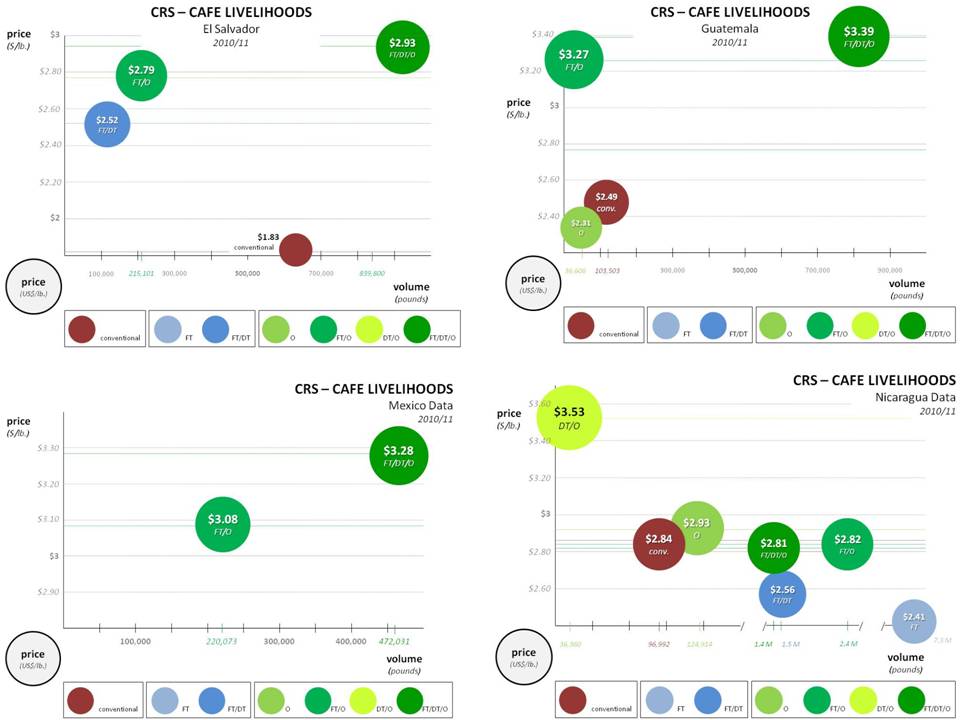
This chart is an aggregation of the data analysis we have performed on the country level in each of the four countries where we implelemented CAFE Livelihoods with our cooperative and NGO partners.
What the data show is at one level consistent with what we think we know about coffee prices: organic certification (average price, $2.79/lb.) and Fair Trade Certification ($2.41/lb.) both add value to smallholder coffee, especially when they go together (average price for FT/O coffee: $2.84/lb.). This particular data set suggests that organic certification may have been more valuable than FT certification: certified organic coffee came in 38 cents higher on average than coffee that was just FT Certified. And the average price for coffee that had both organic and Fair Trade certifications (FT/O) was only 5 cents per pound higher than certified organic coffee, but 43 cents per pound higher than the average price for coffee that had a stand-alone FT Certification.
The other suggestion the data make is that all three of these certification options — organic, Fair Trade and FT/O — are associated with higher average prices in the context of direct trading relationships.
The “Direct Trade premium” was 15 cents per poundfor FT Certified coffee(from $2.41 to $2.56) and 13 cents per pound for FT/O ($2.894 to $2.97). The significant “DT premium” for certified organic coffee (74 cents per pound) is explained by the fact that the DT/O coffee that fetched an average price of $3.53 per pound was of extraordinary quality.
This reflects one of the two principal flaws of these data: they do not take into consideration price differentials for quality, even though we know that there were significant quality differences bewteen coffee lots sold within each of the trading categories identified here.
Nor does the data take into consideration the date at which prices were fixed. When farmers in El Salvador started fixing prices in September 2010, the average NY “C” price for “other milds” was $2.22 a pound. By April 2011, it had climbed to $3.04 a pound. In other words, the value of coffee with the same certifications and quality profile rose over time — this variability is not captured by this data analysis.
Furthermore, we know that price is only one dimension of trading relationships. There are others that must also be examined to get a fuller picture of the relative value and developmental impact of different trading approaches: access to technical assistance, finance and project funding, transparency and trust, etc. We will be applying these criteria retroactively to our CAFE Livelihoods data set, and building them proactively into the DNA of our monitoring and evaluation systems for future work in coffee value chains.
Meantime, I thought these data were interesting enough to publish here on their own.


