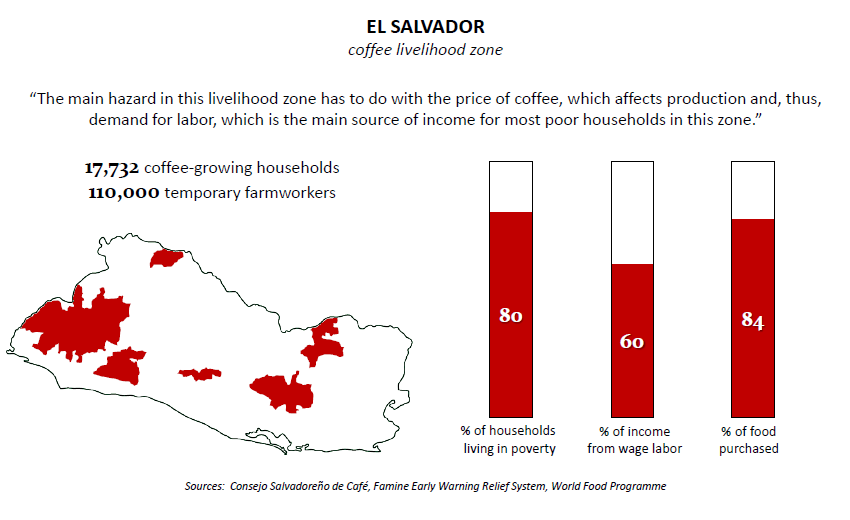
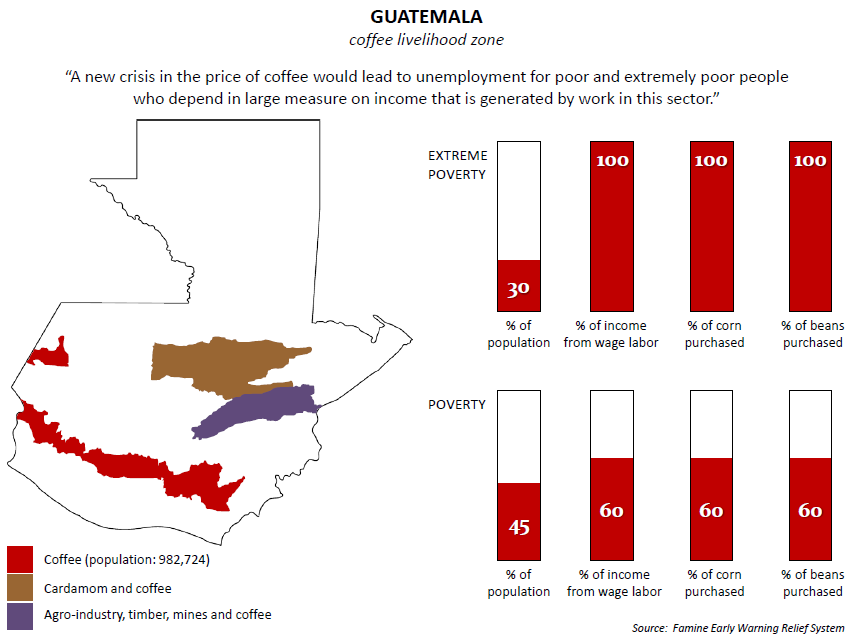
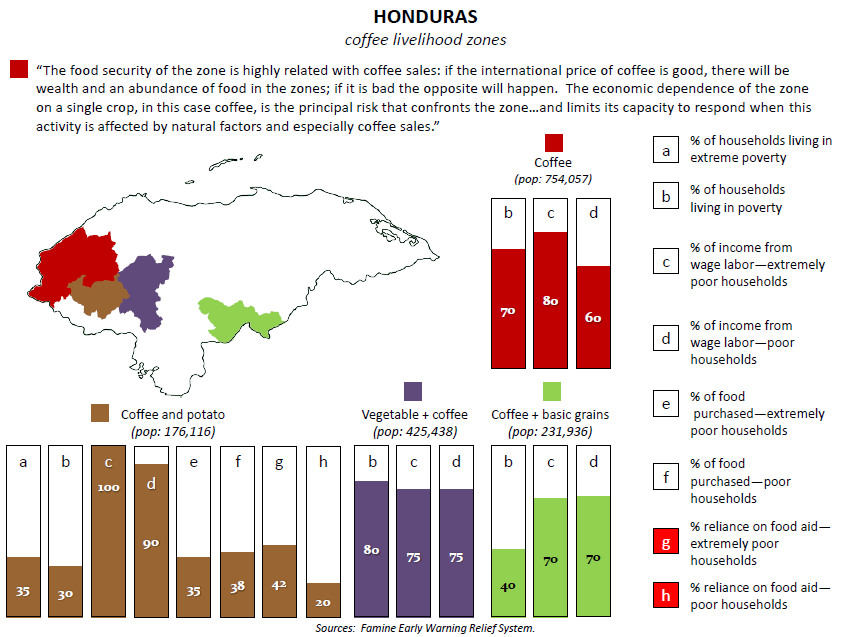
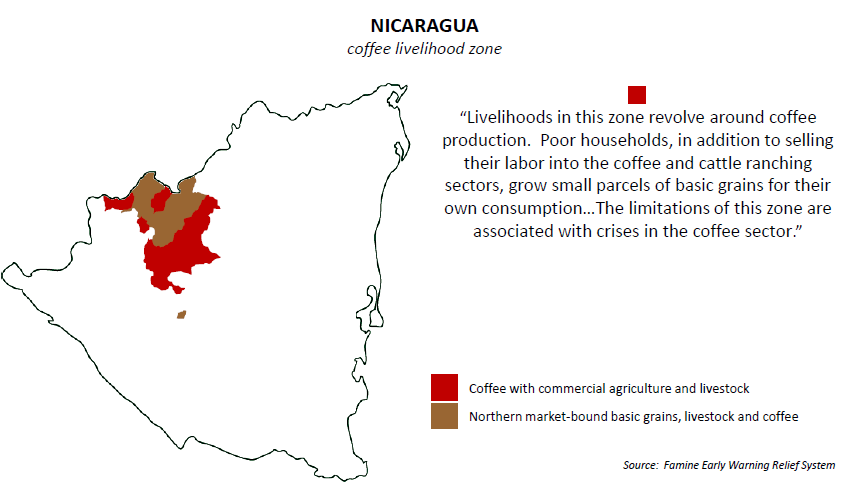
As a principle, I believe that we learn better from direct experience than from books and data and graphics. And as a matter of experience, I know that traveling to the coffeelands can be a source of endless illumination about the secret lives of coffee farmers. Nothing helps us understand the vulnerability of poor households in the coffeelands better than spending time in them. But in order to truly appreciate the scope of that vulnerability, some data and graphics can help.
Against the backdrop of the coffee rust crisis in Central America, where coffee yields and demand for harvest labor during could be down by as much as 40 percent next year, they tell a chilling story.
LIVELIHOODS STRATEGIES
While I mostly encounter the term “livelihoods” in the literature on international development, it is a concept that can be applied universally. We all have livelihood strategies. Members of every household settle–sometimes tacitly and sometimes explicitly, sometimes freely and sometimes under coercion–on a mix of activities that we believe will best meet the diverse needs of everyone in the household. For me and many of the people reading this blog, that means a salaried job and benefits for at least one member of the household. In the coffeelands in Central America, livelihood strategies are significantly more complex and fragile.
The Famine Early Warning System Network (FEWS NET) is a USAID-funded project that has published best-in-class analyses of livelihood strategies in Central America, dividing all four of the CA4 countries above into livelihood zones based on the dominant livelihood strategies in different parts of each country. The FEWS NET livelihood maps are accompanied by rigorous analysis of the livelihood dynamics and data in each zone.
In each Central American country, FEWS NET identifies at least one zone dominated by coffee. In Nicaragua, there are two zones in which coffee is a primary economic activity. In Guatemala, three. And in Honduras, four. The data and analysis of each zone highlighted in the graphics above tell a story of structural vulnerability in the coffeelands.
STRUCTURAL VULNERABILTY
The coffee livelihoods zones identified above are home to more than a quarter of a million coffee-growing households. Many of them are poor. But they are not generally the poorest households in the coffeelands. That distinction belongs to landless families who depend on wage labor–especially during the annual coffee harvest–for their income and food. Both groups–growers and pickers–are vulnerable to shocks caused by factors beyond their control, but the degree of their vulnerability varies.
The poorest households in the coffeelands earn most of their income by selling their labor, and the primary source of demand for that labor is the annual coffee harvest. With the income they earn from the coffee harvest and other agricultural labor, they buy most or all of their food, since they have little or no land of their own on which to grow food for their families. As the excerpts above suggest, shocks to the coffee sector can have dire impacts on the income and food security of these households. Much of the language here refers to price shocks, which reduce the earnings of growers who sell their coffee and lead them to hire less labor. But production shocks, like the current coffee leaf rust epidemic, have the same effect: they reduce the earnings of coffee growers and the demand for coffee pickers.
What will happen to these families if production losses and reduction in demand for seasonal labor during the harvest reach 40 percent?
COPING STRATEGIES
Unfortunately, the strategies that poor households employ to cope with economic stress tend to produce pan para hoy, hambre para mañana–they meet immediate financial and food needs in ways that undermine the longer-term economic, social and environmental well-being of their families and their communities.
They cut back on food. Borrow money. Work longer hours. Sell assets. Cut down coffee forests to plant food crops. Migrate. Or worse yet, seek income from the region’s growing illicit economy.
– – – – –
GO TO THE SOURCE
For more information on Central America livelihood zones and vulnerability to hunger, download the original FEWS NET documents from which the data for this post were taken.
Livelihood Maps
- El Salvador (solo en español)
- Guatemala (English) (español)
- Honduras (English) (español)
- Nicaragua (English) (español)
Livelihood Zone Profiles
- El Salvador (English) (español)
- Guatemala (solo en español)
- Honduras (English) (español)
- Nicaragua (English) (español)


